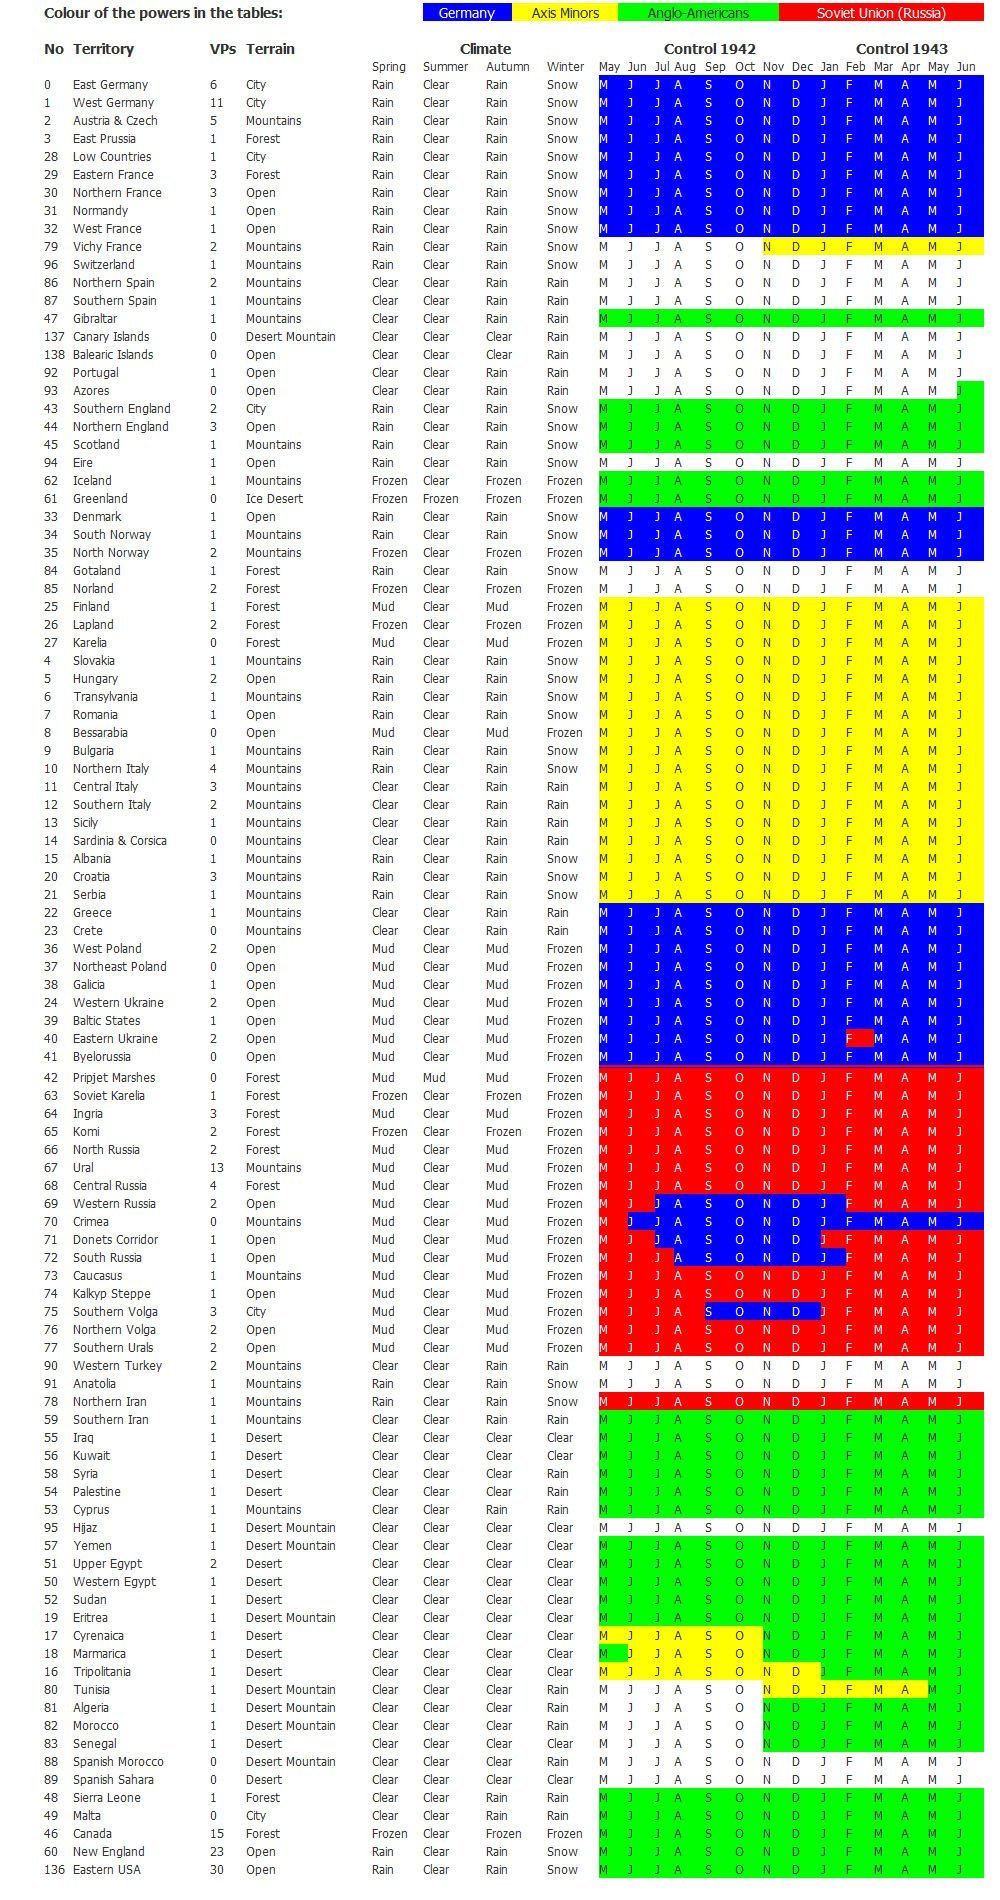
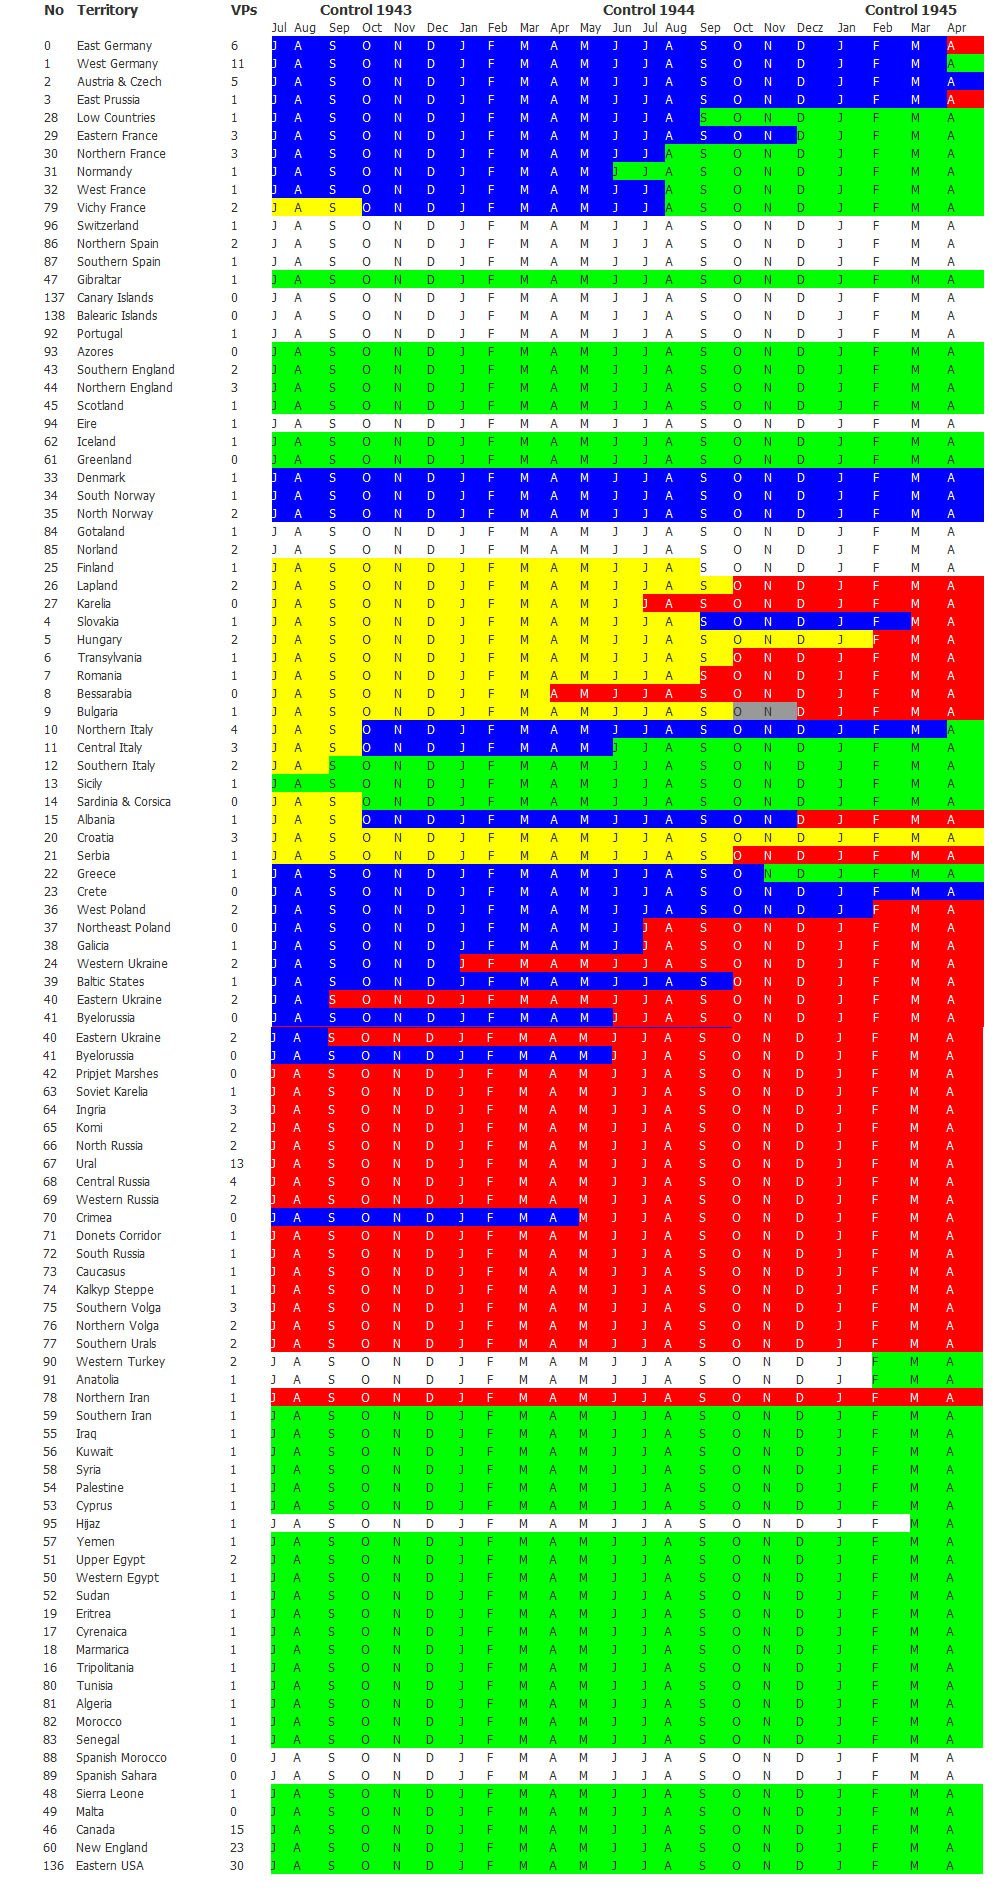
The map of the control of territories in the European theater of war from 1942-45.
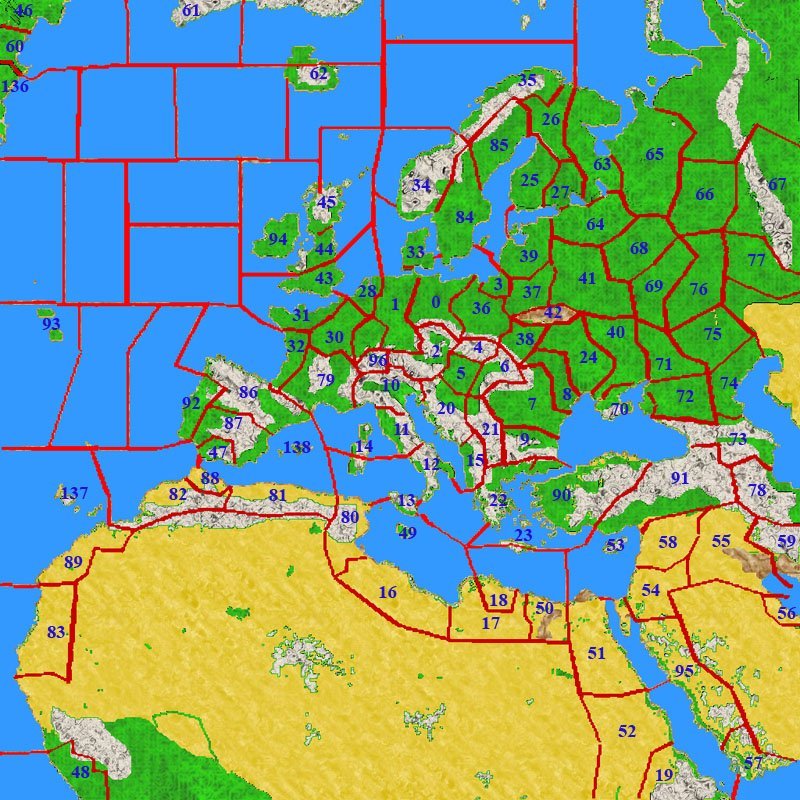
Above is the strategic map of the European theater of war for the war game WW2 Total. The individual territories are marked with red borderlines and are mainly strategic regions which were mostly captured during single offensives in World War II.
Control of Territories
Within the following tables the most important information about each territory is given, such as the ‘victory points’ (VP are important for the ‘production points’ PP), the terrain and seasonal weather. Additional, which power the particular territory controlled at the end of each month during World War II.
Control from mid-1943 to the war’s end:
Resulting ‘Production Points’ (PP) for arms production
Comparison of the average number of annual ‘production points’ (1 VP = 50 PP’s) for the war game WW2 Total and the historical production figures, in the case that the territories are under control by the different powers as marked in the tables above:
Comparison of Production vs Control of Territories:
Nation | 1942: in-game | historically | 1943: in-game | historically | 1944: in-game | historically | 1945 (Jan-Apr): in-game | historically |
|---|---|---|---|---|---|---|---|---|
GERMANY | 2,500(*) | 2,911 | 2,229(*) | 2,931 | 1,966(*) | 2,333 | 1,275(*) | 1,898 (Jan-Feb) |
AXIS MINORS | 1,242 (* - effective 965) | 412 | 1,091 (* - effective 823) | 288 | 800 (* - effective 555) | 66 | 337 (* - effective 225) | ? |
AXIS TOTAL | 3,465 effective (*) | 3,323 | 3,052 effective (*) | 3,219 | 2,521 effective (*) | 2,399 | 1,500 effective (*) | 1,898+ |
USSR (RUSSIA) | 1,750 | 1,724 | 1,987 | 1,984 | 2,187 | 2,162 | 2,850 | 2,519 (Jan-Jun) |
ANGLO-AMERICANS | 4,514 | 4,537 | 4,658 | 4,662 | 4,983 | 4,973 | 5,775 | 4,973+ |
ALLIES TOTAL | 6,264 | 6,261 | 6,645 | 6,646 | 7,170 | 7,135 | 8,625 | 7,492+ |
GRAND TOTAL OF AXIS&ALLIES | 9,729 | 9,584 | 9,697 | 9,865 | 9,691 | 9,534 | 10,125 | 9,390+ |
(*) During WW2 large supplies of arms (sometimes in return for important raw materials) were supplied by Germany to her allies. For the war game WW2 Total this is taken into account by the fact, that a part of the German victory points are placed in raw material provinces of Axis minors (e.g. for oil from Ploesti in Romania, nickel from northern Finland, etc.) and can be used by this player.
However, it must be considered that the productivity of the Axis Minors is about 30% lower than for Germany, which resulted in an increase of these transferred VP in the Axis minors territories. Additional, because of the higher German productivity and quality of manufactured weapons for these transferred ‘production points’, and the fact that the Germans later occupied some of their allies (Italy, Slovakia) which have changed side to the Allies (and what can not happen to the Axis Minors player in the war game), resulted in an increase of 1.5 times of this transferred or occupied VP’s.


