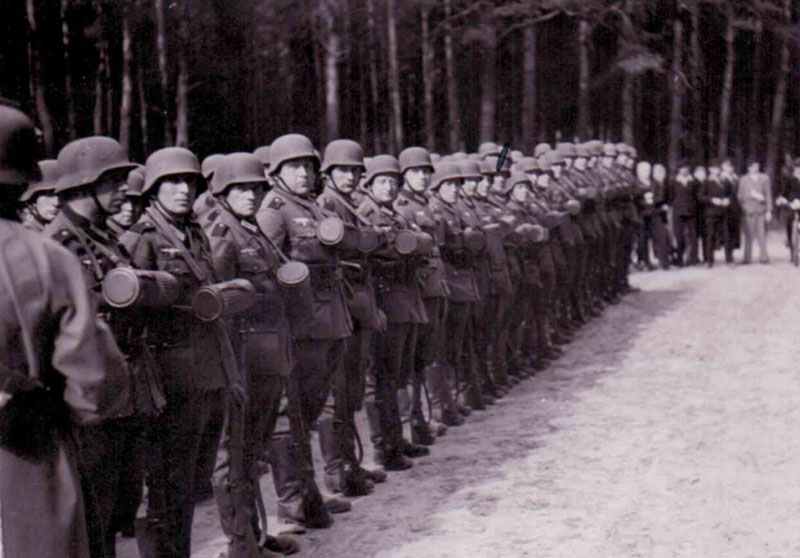
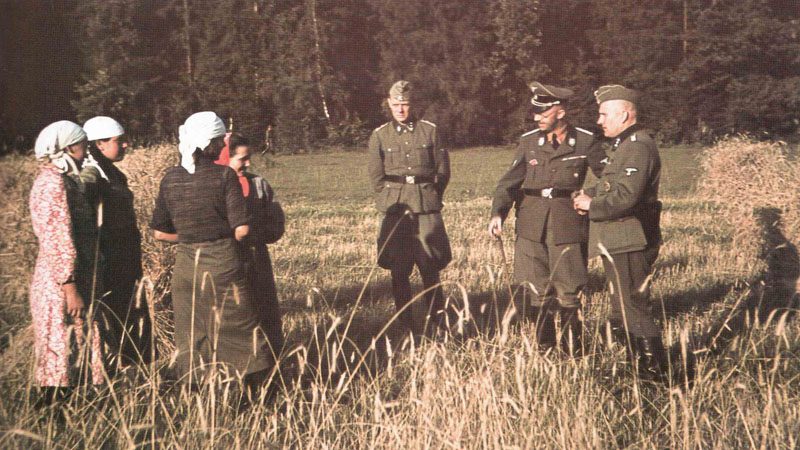
German military performance against the Western Allies in France and on the German frontier in 1944.

Military performance on the Western Front in 1944
Table of Contents
The liberation of Western Europe by the Allies in 1944 was a pivotal moment in World War II. Here’s a brief overview of the events:
D-Day (June 6, 1944): Allied forces, primarily from the United States, United Kingdom, and Canada, launched a massive amphibious invasion of Normandy, France. This marked the beginning of the liberation of Western Europe from Nazi occupation.
Expansion of the beachhead: After securing the beaches, Allied forces began to push inland, liberating French towns and cities. The city of Caen was a key objective and saw heavy fighting.
Operation Dragoon (August 15, 1944): A second Allied invasion was launched in southern France, further stretching German forces and accelerating the liberation of the country.
Liberation of Paris (August 25, 1944): Following an uprising by the French Resistance and the arrival of Allied forces, Paris was liberated from German control.
Market Garden and the Battle of the Bulge: The Allies attempted to secure key bridges in the Netherlands (Operation Market Garden) in September 1944 but faced setbacks. In December, Germany launched a counteroffensive in the Ardennes region (Battle of the Bulge), which was eventually repelled by Allied forces.
Crossing the Rhine and the end of the war: In early 1945, the Allies crossed the Rhine River into Germany, leading to the eventual surrender of Nazi forces and the end of World War II in Europe on May 8, 1945.
The liberation of Western Europe was a significant turning point in the war, leading to the defeat of Nazi Germany and the restoration of freedom in occupied countries.
Military performance of the German and Western Allied armed forces
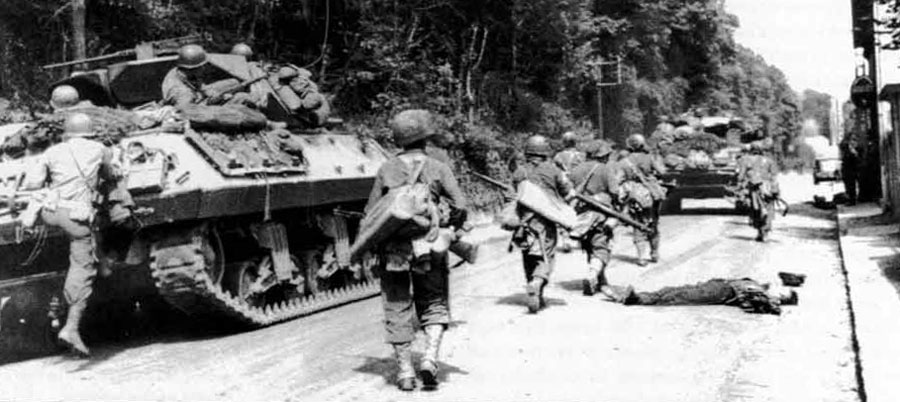
As Rommel had forecast, the ensuing three months after the Allied invasion in Normandy on June 6, 1944, were a time of unmitigated disaster for the German armies in France.
After the ‘brutal slugging battles’ for Caen and Falaise, as Eisenhower described them, and the Allied invasion of Southern France in mid-August, the Germans were driven helter-skelter out of every corner of France, except Dunkirk and the beleaguered former U-boat bases on the Atlantic coast.
Rommel himself was almost killed by a low-flying Spitfire Mk IX on July 17 and three days later a group of highranking German officers belatedly attempted to save the Army, and Germany itself from utter destruction by planting a time-bomb in Hitler’s Headquarters Wolfsschanze.
Hitler survived to wreak a terrible vengeance on at least 2,000 army officers (including Rommel) and launch a desperate counter-attack on the Western Front in December 1944, now known as the ‘Battle of the Bulge’.
But Nazi Germany’s military position had been hopeless ever since she had failed to drive the Allied forces into the sea on D-Day. The only question remaining in December 1944 was who would win the race to Berlin – the British, Americans and Canadians from the West, or the Red Army from the East.
The following battles took place in the phase after the outbreak of the Allied forces from their bridgehead from Normandy, beginning with the American advance south of the pocket of Falaise towards the Seine and then the Marne south around Paris.
This is followed by battles with heavy fighting on the German frontier in the Saar region, which took place from November until shortly before the German offensive.
In all these engagements, the German troops were mostly in the minority, with less material and practically no support from the air.
The figures correspond to those of the military performance of the battles against the Western Allies in Italy 1943-44 and also the exact explanation can be found on this page.
FRANCE – Le Masto-Metz (August 14-September 14, 1944):
Engagement | Units | Ratio soldiers | Result | Casualties per day | Score Effect |
|---|---|---|---|---|---|
Seine River (August 23-25) | US XX Corps | 271% | attack successfully | 0.19% | 1.20 |
1 Army | fortified defense failed | 2.01% | 1.48 |
||
Moselle-Metz (September 6-11) | US XX Corps | 144% | attack successfully | 0.46% | 1.09 |
1 Army | delaying defense failed | 0.68% | 1.44 |
||
Metz (Sep 13) | US XX Corps | 154% | attack failed | 0.59% | 1.11 |
1 Army | fortified defense successfully | 0.53% | 1.76 |
||
Chartres (August 16) | US 7 AD | 188% | attack successfully | 0.72% | 1.97 |
various units of 1 Army | defense failed | 6.95% | 2.24 |
||
Melun (August 23-25) | US 7 AD | 287% | attack successfully | 0.19% | 1.03 |
48 ID reinforced | prepared defense failed | 2.02% | 2.13 |
SAAR CAMPAIGN (November 8-December 7, 1944):
Engagement | Units | Ratio soldiers | Result | Casualties per day | Score Effect |
|---|---|---|---|---|---|
Chateau Salins (Nov 10-11) | US 35 + 26 ID + 4 AD | 390% | attack and defense draw | 0.82% | 1.14 |
11 Pz.Div + parts of XIII SS-Pz Corps | fortified defense and attack draw | 1.99% | 3.21 |
||
Morhange-Conthil (Nov 13-15) | US 4 AD + parts 35 ID | 343% | attack successfully | 1.54% | 0.87 |
11 Pz.Div + 361 ID | delaying defense failed | 0.87% | 3.54 |
||
Bourgaltroff (Nov 14-15) | US 4 AD + parts 26 ID | 159% | attack failed | 0.89% | 1.27 |
parts 11 Pz.Div + 361 ID | delaying defense successfully | 1.08% | 1.98 |
||
Baerendorf I (Nov 24-25) | US 4 AD | 148% | attack and defense successfully | 0.37% | 1.41 |
Pz-Lehr + 361 ID | defense and attack failed | 2.09% | 1.26 |
||
Baerendorf II (Nov 26) | US 4 AD | 227% | attack successfully | 0.35% | 1.54 |
Pz-Lehr | defense failed | 3.33% | 1.17 |
||
Burbach-Dustel (Nov 27-30) | US 4 AD | 242% | attack failed | 0.16% | 1.01 |
Pz-Lehr | delaying defense successfully | 1.07% | 0.76 |
||
Sarre Union (Dec 1-2) | US 4 AD | 327% | attack successfully | 0.70% | 0.73 |
11 Pz.Div + Pz-Lehr + 25 Pz.Gren. | prepared defense failed | 1.08% | 1.93 |
||
Singlin-Binning (Dec 6-7) | US 4 AD | 302% | attack failed | 0.51% | 0.92 |
25 Pz.Gren. + 11 Pz.Div | fortified defense successfully | 1.21% | 1.52 |
||
Seille River (Nov 8-12) | US XII Corps | 422% | attack successfully | 0.86% | 1.69 |
XIII SS + LXXXIX Corps | fortified defense failed | 4.14% | 2.79 |
||
Morhange-Faulquemont (Nov 13-16) | US XII Corps | 326% | attack first failed, later successfully | 0.87% | 1.74 |
XIII SS + LXXXIX Corps | delaying defense first successfully, later failed | 3.23% | 2.54 |
||
Francaltroff-St.Avold (Nov 20-27) | US XII Corps | 275% | attack successfully | 0.46% | 1.45 |
XIII SS + LXXXIX Corps | delaying defense failed | 1.91% | 2.75 |
||
Durstil-Farebersviller (Nov 28-29) | US XII Corps | 293% | attack failed | 0.27% | 1.13 |
XIII SS + LXXXIX Corps | delaying defense successfully | 1.32% | 1.29 |
||
Sarre River (Dec 5-7) | US XII Corps | 286% | attack successfully | 0.42% | 1.39 |
XIII SS + XC Corps | delaying defense failed | 1.88% | 1.47 |
Statistical comparison
Now the statistical comparison of the combat value of the investigated units in a total of 78 engagements.
All Engagements Total:
Side | Total numbers engaged | Total Casualties | Average Casualties per day | Average Score Effectiveness |
|---|---|---|---|---|
Western Allies | 1,783,237 | 47,743 | 1.25% | 1.45 |
Germans | 940,198 | 48,585 | 1.83% | 2.25 |
Effectiveness by Posture vs Western Allies:
Posture | Allies | Germans | German Preponderance |
|---|---|---|---|
Attack Succesful | 1.47 | 3.02 | 205% |
Attack Failure | 1.20 | 2.28 | 190% |
Defense succesful | 1.60 | 2.24 | 140% |
Defense Failure | 1.37 | 2.29 | 167% |
Average based on total battles | 1.45 | 2.31 | 159% |
Most effective units
Subsequently, the combat effectiveness of those units which took part in at least three of the examined engagements. The average combat value of the German troops is about 23 percent higher than that of the allied troops.
Average Unit Combat Effectiveness:
Division/Corps | No of battles | Average Intensity | Average Differential from Normal | Assessed Score-Effectiveness (Kills) | Assessed Combat Effectiveness |
|---|---|---|---|---|---|
US | |||||
1st Armored | 3 | 6.77 | -0.08 | 2.63 | 86.60 |
3rd Infantry | 4 | 4.80 | -0.87 | 1.31 | 66.17 |
4th Armored | 8 | 3.95 | -1.47 | 1.11 | 61.59 |
34th Infantry | 5 | 4.14 | -1.52 | 1.40 | 65.28 |
45th Infantry | 9 | 4.29 | -1.30 | 1.40 | 64.50 |
85th Infantry | 5 | 5.28 | -1.73 | 1.95 | 71.95 |
88th Infantry | 4 | 5.02 | 0.28 | 2.40 | 84.64 |
XII Corps | 5 | 4.78 | -0.48 | 1.48 | 69.69 |
XX Corps | 3 | 3,93 | -1.93 | 1.13 | 60.09 |
Average Effectiveness US | 70.06 |
||||
BRITISH | |||||
1st Infantry | 8 | 5.71 | - | 1.66 | 70.37 |
5th Infantry | 3 | 4.47 | - | 2.13 | 74.92 |
7th Armored | 3 | 2.97 | - | 1.11 | 64.50 |
46th Infantry | 6 | 5.27 | - | 1.11 | 65.76 |
56th Infantry | 9 | 5.56 | - | 1.08 | 54.15 |
Average Effectiveness British | 65.94 |
||||
ALLIES AVERAGE EFFECTIVENESS | 68.59 |
||||
GERMAN | |||||
Hermann Goering Pz.Div | 5 | 3.52 | +0.57 | 2.54 | 87.43 |
Panzer-Lehr | 4 | 4.70 | +0.57 | 1.28 | 70.63 |
3rd Pz.Gren | 16 | 4.24 | +0.65 | 2.10 | 81.83 |
4th Para Div | 4 | 6.03 | +1.25 | 2.63 | 90.90 |
11th Panzer | 5 | 3.88 | +1.18 | 2.44 | 88.13 |
15th Pz.Gren | 9 | 1.52 | +0.11 | 2.09 | 79.90 |
16th Panzer | 7 | 3.50 | -0.38 | 2.84 | 88.62 |
65th Infantry | 5 | 5.82 | +0.54 | 2.28 | 83.87 |
94th Infantry | 8 | 6.46 | -0.09 | 3.05 | 92.03 |
362nd Infantry | 3 | 9.10 | -1.16 | 2.74 | 84.33 |
XIII SS-Panzer Corps | 5 | 7.08 | +0.76 | 1.98 | 80.60 |
Average Effectiveness Germans | 84.36 (exceeds Allied average by 23%) |

see also: Battle results of World War One
References and literature
Der Genius des Krieges (Trevor N. Dupuy)
Der 2. Weltkrieg (C. Bertelsmann Verlag)
Zweiter Weltkrieg in Bildern (Mathias Färber)
A World at Arms – A Global History of World War II (Gerhard L. Weinberg)
Der Grosse Atlas zum II. Weltkrieg (Peter Young)
Historical Atlas of World War Two – The Geography of Conflict (Ronald Story)
Krieg der Panzer (Piekalkiewicz)
Luftkrieg (Piekalkiewicz)


