Military production and imports of Japan in World War II.
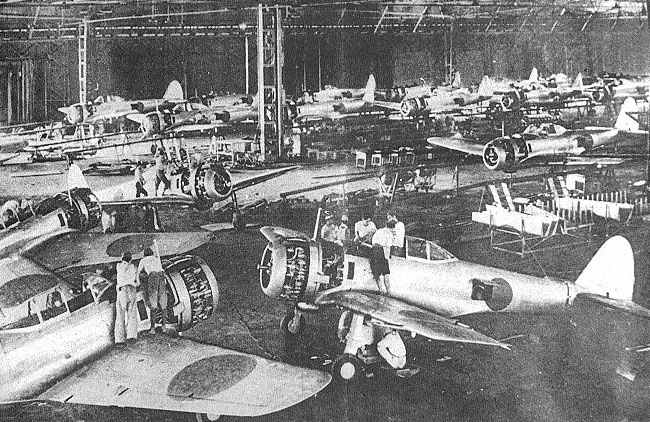
Japanese military production in WW2
Table of Contents
The annual Japanese armaments and military equipment production (excluding ammunition) and a comparison of the necessary strategic raw materials.
Since Japan was virtually dependent on full import of key raw materials, also a breakdown of the development of import figures during the war.
Military production figures of Japan by weapon type
The Japanese annual production figures of the known main arms and military equipment (without ammunition) during WW2 from 1939-1945.
Armaments:
| Type of Weapon | 1939 | 1940 | 1941 | 1942 | 1943 | 1944 | 1945 | TOTAL |
|---|---|---|---|---|---|---|---|---|
| Tanks (without light tanks and tankettes) | - | 315 | 595 | 557 | 558 | 353 | 137 | 2,515 |
| Field and infantry guns | ? | ? | 2,250 | 2,550 | 3,600 | 3,300 | 1,650 | 13,350 |
| Machine-guns (without sub-machine guns) | ? | ? | ? | ? | ? | ? | ? | 380,000 |
| Sub-machine guns | - | - | 10,000 (1941-44) | ? | ? | ? | 7,000 | 17,000 |
| Military trucks and lorries | ? | 38,056 | 46,389 | 35,386 | c.24,000 | 20,356 | 1,758 | 165,945 |
| Fighter planes | ? | ? | 1,080 | 2,935 | 7,147 | 13,811 | 5,474 | 30,447 |
| Bomber planes | ? | ? | 1,461 | 2,433 | 4,189 | 5,100 | 1,934 | 15,117 |
| Reconnaissance planes | ? | ? | 639 | 967 | 1,046 | 2,147 | 855 | 5,654 |
| Training planes | ? | ? | 1,489 | 2,171 | 2,871 | 6,147 | 2,523 | 15,201 |
| Aircraft carriers (CV) | - | - | 1 | 6 | 4 | 5 | - | 16 |
| Battleships (BB) | - | - | 1 | 1 | - | - | - | 2 |
| Cruisers (CA) | - | - | - | 4 | 3 | 2 | - | 9 |
| Destroyers (DD) | - | - | - | 10 | 12 | 24 | 17 | 63 |
| Submarines | - | - | - | 61 | 37 | 39 | 30 | 167 |
| Merchant shipping tonnage | 320,466 | 293,612 | 210,373 | 260,059 (Tankers: 20,361) | 769,085 (Tankers: 169,491) | 1,699,203 (Tankers: 754,889) | 599,563 (Tankers: 351,028) | 4,152,361 |
Raw material production for the military weapon production above:
| Year | 1939 | 1940 | 1941 | 1942 | 1943 | 1944 | 1945 |
|---|---|---|---|---|---|---|---|
| Coal | ? | ? | ? | 61.3 | 60.5 | 51.7 | 11.0 |
| Iron | ? | ? | ? | 7.4 | 6.7 | 6.0 | 0.9 |
| Steel | ? | ? | ? | 8.0 | 8.8 | 6.5 | 0.8 |
| Aluminium (in 1,000 tons) | ? | ? | ? | 103.0 | 141.0 | 110.0 | 7.0 |
Annual strategic raw material production (m. metric tons):
| 1939 | 1940 | 1941 | 1942 | 1943 | 1944 | 1945 | |
|---|---|---|---|---|---|---|---|
| Coal | ? | ? | ? | 61.3 | 60.5 | 51.7 | 11.0 |
| Ore | ? | ? | ? | 7.4 | 6.7 | 6.0 | 0.9 |
| Steel | ? | ? | ? | 8.0 | 8.8 | 6.5 | 0.8 |
| Aluminium (in 1,000 metric tons - especially important for aircraft production) | ? | ? | ? | 103.0 | 141.0 | 110.0 | 7.0 |
Import of raw materials
A vital sector of the decisive battle of production for the Japanese was that of import of raw materials, especially of oil.
Annual tonnage of Japanese tankers built, sunk and extant:
Japanese Tankers Tonnage:
| Tonnage built | Tonnage sunk | Tonnage available at the end of the year | |
|---|---|---|---|
| 1941 | - | - | 578,000 |
| 1942 | 20,316 | 9,538 | 686,000 |
| 1943 | 254,927 | 169,491 | 873,000 |
| 1944 | 624,290 | 754,889 | 860,000 |
| 1945 | 85,651 | 351,028 | 266,948 |
Annual Japanese imports of key strategic raw materials and foodstuffs in 1,000 metric tons:
Annual Japanese imports:
| 1941 | 1942 | 1943 | 1944 | 1945 | |
|---|---|---|---|---|---|
| Oil | 1,090 | 1,360 | 1,880 | 650 | - |
| Coal | 6,460 | 6,390 | 5,180 | 2,630 | 548 |
| Iron ore | 6,310 | 4,700 | 4,300 | 2,150 | 341 |
| Iron and steel | 921 | 993 | 997 | 1,100 | 170 |
| Scrap iron | 246 | 50 | 43 | 21 | 12 |
| Bauxite | 150 | 305 | 909 | 376 | 15 |
| Lead | 86 | 11 | 25 | 17 | 4 |
| Tin | 5 | 4 | 27 | 23 | 4 |
| Zinc | 8 | 8 | 10 | 6 | 2 |
| Raw rubber | 68 | 31 | 42 | 31 | 18 |
| Total strategic raw material imports | 15,344 | 13,852 | 13,413 | 7,004 | 1,114 |
| Food: rice | 2,110 | 2,250 | 990 | 652 | 201 |
| Food: peas and beans | 546 | 684 | 276 | ? | ? |
| Overall | 18,000 | 16,786 | 14,679 | 7,656 | 1,315 |
Why Japan really lost the war
It is no secret that Japan was at a disadvantage compared to the Allies during the Second World War. However, the extent of this ‘disadvantage’ is staggering.
This comparison will focus primarily on the two main adversaries in the Pacific War: Japan and the United States.
Overview
By the time World War II began to rear its ugly head (formally in Poland in 1939, informally in China in 1937), America had already been in the grip of the Great Depression for more or less a decade. The impact of the Depression was that there was a major ‘slump’ in the US economy.
Many US workers were either unemployed (10 million in 1939) or underemployed, and American industry as a whole had far more capacity than was needed at the time. From an economic perspective, ‘capacity utilization’ was very low.
To an outside nation, – especially a militaristic culture like Japan’s – America certainly appeared ‘soft’ and unprepared for a major war. Moreover, Japan’s successes in fighting obviously far more fearsome opponents (Russia in the early 1900s and China in the 1930s) and the fact that Japan’s own economy was virtually ‘overheated’ (largely as a result of excessive military spending – 28% of national income in 1937) had created a misplaced sense of economic and military superiority over their great overseas rival.
However, a sober observer would have noted some important facts: America, even in the midst of a seemingly endless economic slump, still had:
– Almost twice the population of Japan.
– The national income was seventeen times that of Japan.
– Steel production was five times greater than in Japan.
– Coal production was seven times greater than in Japan.
– Automobile production was eighty times (80x !) greater than Japan.
America also had some hidden advantages that were not directly reflected in the production figures. For one thing, factories in the US were on average more modern and automated than those in Europe or Japan. In addition, American management practices at the time were the best in the world. Taken together, the per capita productivity of the American worker was the highest in the world.
Moreover, the United States was more than willing to use its women in the war: a tremendous advantage for the Allies and a concept that the Axis powers seem to have grasped only very late in the conflict.
The net effect of all these factors meant that the American war potential, even at the depths of the Depression, was still about seven times greater than the Japanese, and had the ‘margin’ been fully utilized in 1939, it would have been almost nine or ten times greater!
In fact, an overview of the total global armaments potential in 1937 looks something like this:
| Country | % of total warmaking potential |
|---|---|
| U.S.A. | 41.7 % |
| Germany (without Austria and Czech protectorate) | 14.4 % |
| Soviet Union (Russia) | 14.0 % |
| United Kingdom | 10.2 % |
| France | 4.2 % |
| Japan | 3.5 % |
| Italy | 2.5 % |
| Total of the seven world powers | 90.5 % |
When the Japanese attacked Pearl Harbor in December 1941, the sleeping giant was awakened to trouble. And although most of America’s war potential was earmarked for use against Germany (which was by far the Axis powers’ most dangerous enemy for economic and technological reasons, as well as its proximity to Britain), there was still enough left over to use against Japan.
By mid-1942, even before US military power was dramatically felt around the world, American factories nevertheless began to make a significant contribution to the war effort.
The US produced seemingly endless quantities of equipment and supplies, which were then delivered not only to its own armed forces, but also to those of Britain and the USSR.
By 1944, most of the other warring powers, although still producing industriously, had begun to run their economies to full capacity (i.e. production stabilized or stagnated). This resulted from the destruction of industrial bases and the scarcity of resources (in the case of Germany and Japan) or the sheer exhaustion of the labor force (in the case of Britain and, to a lesser extent, the USSR).
In contrast, the United States suffered from none of these difficulties and, as a result, its economy grew at an annual rate of 15% throughout the war years.
War production
So what was the concrete result in terms of ‘weapons and ammunition’ of the two powers competing in the Pacific?
We start with the warships because they were a very important indicator of military power in the Pacific War.
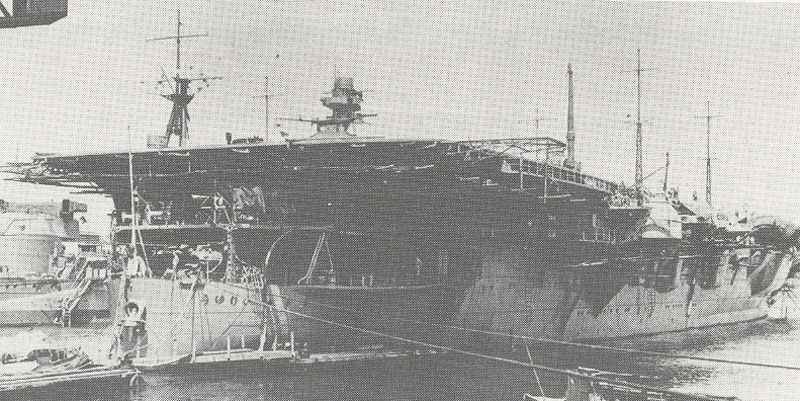
From 1941 to 1945, the USA built a total of 141 fleet carriers, light carriers and escort carriers. In addition, there were 10 battleships, 48 light and heavy cruisers, 349 destroyers, 498 escort ships and 203 submarines.
As can be seen from the overview for Japan above, only 16 aircraft carriers of all sizes, 2 battleships, 9 cruisers, 63 destroyers and 167 submarines were commissioned.
However, several points should be noted:
First, most of the carriers listed in the US totals were small escort carriers that carried only a few dozen aircraft and were primarily suited for escort duties rather than naval combat – though this did not detract from their effectiveness in anti-submarine warfare or in supporting ground forces during invasions.
However, it should also be noted that the American fleet carriers had, on average, much larger air squadrons than their Japanese counterparts (80-90 versus 60-70 aircraft).
The end result was that by 1944, when Task Force 38 or 58 (depending on whether Halsey or Spruance was in command of the main American carriers at the time) came into play, they could count on bringing nearly a thousand combat planes with them.
This kind of show of force was crucial to winning the war, as the Americans could literally bring more planes than any Japanese airbase in the Pacific could muster for its own defense. That led to the neutralization of Truk or the Marshall Islands.
The other important figure here is the total of destroyers and escort ships. Japan, an island nation entirely dependent on maintaining open sea lanes to secure its raw material imports, was only able to build sixty-three destroyers (of which about twenty would have been classified by the Allies only as convoy destroyers) and an unspecified (a presumably relatively small) number of ‘escort ships’.
In the same period, the US launched some eight hundred and forty-seven escort ships and destroyers!
And this total does not even include the small ships such as the armed yachts and submarines that were used off the east coast against the German U-boats.
All in all, American naval power at the end of the war was greater than ever before. In fact, by 1945, the U.S. Navy was larger than all other navies in the world combined!
The Pacific War was also a war of merchant ships, as virtually everything needed to defend or attack the various island outposts of the Japanese Empire had to be transported across vast stretches of ocean.
Japan also had to maintain its vital supply routes, such as to Borneo and Java, to supply its industrial base. A look at the relative shipbuilding output (in tons) of the two rivals is therefore both interesting and revealing:
| Year | USA | Japan |
|---|---|---|
| 1939 | 376,419 | 320,466 |
| 1940 | 528,697 | 293,612 |
| 1941 | 1,031,974 | 210,373 |
| 1942 | 5,479,766 | 260,059 |
| 1943 | 11,488,360 | 769,085 |
| 1944 | 9,288,156 | 1,699,203 |
| 1945 | 5,839,858 | 599,563 |
| TOTAL | 33,993,230 | 4,152,361 |
These figures are astonishing, as the United States built more merchant ships in the first four and a half months of 1943 than Japan put on the water in seven years. It is also interesting to note that Japanese merchant shipbuilding had not seen an increase until 1943, and by that time it was too late to stop the hemorrhaging.
Just as with their escort shipbuilding programs, the Japanese were victims of their tragically flawed strategy, which assumed that the conflict with the United States would be a short war.
Again, the United States had to build a large proportion of the merchant ships to replace the losses from the German submarines. But it’s no joke to say that the Americans literally built ships faster than anyone could sink them – and that afterward there were still enough left to transport mountains of material to the most godforsaken, desolate parts of the Pacific.
The Polynesian cargo cults didn’t spring up for no reason, and it was American merchant ships by the thousands that brought the bulk of this seemingly divine, lavish largesse to the backwoodsmen who had probably never seen a can opener before.
Finally, no examination of the Pacific War would be complete without a look at the air forces. Despite the talk that the Pacific War was an ‘aircraft carrier war’, an aircraft carrier is really nothing more than a vehicle that carries an airplane to an area of operations.
While aircraft were certainly not capable of capturing and holding islands, air superiority was vital to ensure that such bastions could be shot up and captured.
Below is a table showing the aircraft production of the two opponents:
| Year | USA | Japan |
|---|---|---|
| 1939 | 5,856 | 4,467 |
| 1940 | 12,804 | 4,768 |
| 1941 | 26,277 | 5,088 |
| 1942 | 47,836 | 8,861 |
| 1943 | 85,898 | 16,693 |
| 1944 | 96,318 | 28,180 |
| 1945 | 49,761 | 8,263 |
| TOTAL | 324,750 | 76,320 |
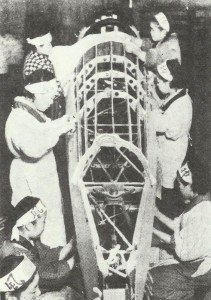
Japan, on the other hand, relied on variants of the Mitsubishi A6M2 Zero fighter for most of the war. The Zero was a brilliant design in many ways, but by 1943 it had been overtaken by the newer American models.
This pattern was repeated in every category of aircraft in the two opposing arsenals. Moreover, a large proportion of total American production (about 97,810 units) consisted of multi-engine (two- or four-engine) bombers, while only 15,117 of the Japanese aircraft were bombers (all of which were only twin-engine models).
So if you look at aircraft production in terms of total number of engines, total weight of aircraft produced or total payload weight, the differences in production become even more apparent.
Strategic hypothesis
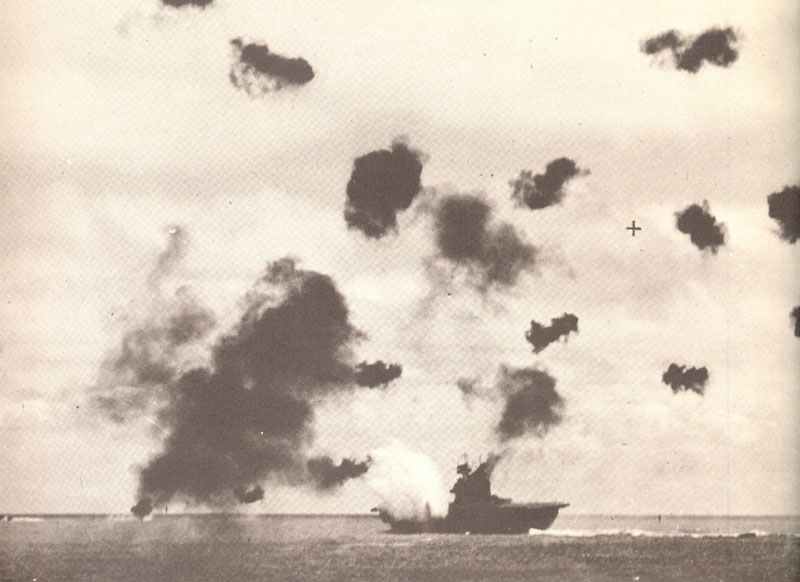
So America had a great advantage. For example, let’s take a moment to appreciate the significance of the Battle of Midway.
Midway is often referred to as the ‘turning point in the Pacific War’ and the ‘battle that was Japan’s undoing’. There is no question that it broke the offensive power of the Japanese navy.
The question that must be asked, however: What difference would America’s economic strength have made if the Americans had suffered a heavy defeat at the Battle of Midway?
In the worst case scenario – which was highly unlikely, however, as the Americans had a strategic surprise advantage – in which a complete reversal of fortune would have occurred, and all three US fleet carriers (Enterprise, Yorktown and Hornet) would have been sunk, while Japan would not have lost any of the four carriers that were deployed.
After such a hypothetical battle, the balance of carrier forces available for deployment in the Pacific would be as follows:
| Midway: before and after | US carriers (planes) | CV's (planes) total | Japanese CV's (planes) | CV's (planes) total |
|---|---|---|---|---|
| pre-Midway (historical) | Saratoga (88), Wasp (im Atlantik; 76), Enterprise (85), Yorktown (85), Hornet (85) | 5 (419) | Kaga (90), Akagi (91), Soryu (71), Hiryu (73), Zuikaku (84), Shokaku (84), Ryujo (38), Zuiho (30) | 6 CV + 2 CVL (561) |
| post-Midway (historical) | Saratoga (88), Wasp (im Atlantik; 76), Enterprise (85), Hornet (85) | 4 (334) | Zuikaku (84), Shokaku (84), Ryujo (38), Zuiho (30) | 2 CV + 2 CVL (246) |
| post-Midway (hypothetical) | Saratoga (88), Wasp (76) | 2 (164) | Kaga (90), Akagi (91), Soryu (71), Hiryu (73), Zuikaku (84), Shokaku (84), Ryujo (38), Zuiho (30) | 6 CV + 2 CVL (561) |
The question is whether an American defeat at Midway would have really mattered. How long would it have taken for America’s shipyards to make up the difference and for the US Navy to go on the offensive?
Let’s find out!
We’ll take the chart above and extend it to the end of the war at 6-month intervals. We make the following assumptions:
Only carriers that were capable of conducting fleet operations are considered. In practice, this means that the ship must have a speed of 28 knots or more and be capable of launching and recovering conventional aircraft.
This means that the Japanese Junyo, Hiyo, Ryuho and the converted Mogami, Ise and Hyuga fall out. However, the Japanese had actually tried to use the Junyo, Hiyo and Ryuho with the Combined Fleet and had limited success.
But they too were either too slow, mechanically unreliable or structurally unsound to be of any real use to the ‘Combined Fleet’.
On the other hand, the Americans constantly deployed their small escort carriers in combat areas, and some of them were instrumental in the Battle of Leyte Gulf. In addition, the older but still reasonably serviceable Ranger was also available.
So if you want to include the Japanese Hiyo, Junyo and Ryuho, you also have to count Ranger and all those small American escort carriers, which then adds over 2,000 carrier aircraft to the American totals.
However, the numbers are clear even without the ‘extras’ – and we are assuming, as previously mentioned, a hypothetical complete defeat of the Americans at the Battle of Midway and no further losses:
| Date | US carriers (planes) total | Japanese carriers (planes) total |
|---|---|---|
| July - Dec 1942 | 2 CV (164) | 6 CV + 2 CVL (561) |
| Jan - June 1943 | 3 CV + 2 CVL (321) | 6 CV + 2 CVL (561) |
| July - Dec 1943 | 7 CV + 7 CVL (850) | 6 CV + 2 CVL (561) |
| Jan - June 1944 | 10 CV+ 9 CVL (1,189) | 6 CV + 4 CVL (621) |
| July - Dec 1944 | 14 CV+ 9 CVL (1,553) | 9 CV + 4 CVL (811) |
| Jan - June 1945 | 17 CV+ 9 CVL (1,826) | 11 CV + 4 CVL (941) |
| July - Dec 1945 (hypothetical) | 20 CV + 9 CVL (2,128) | 12 CV + 5 CVL (1,033) |
| Jan - June 1946 (hypothetical) | 25 CV + 9 CVL (2,612) | 14 CV + 5 CVL (1,163) |
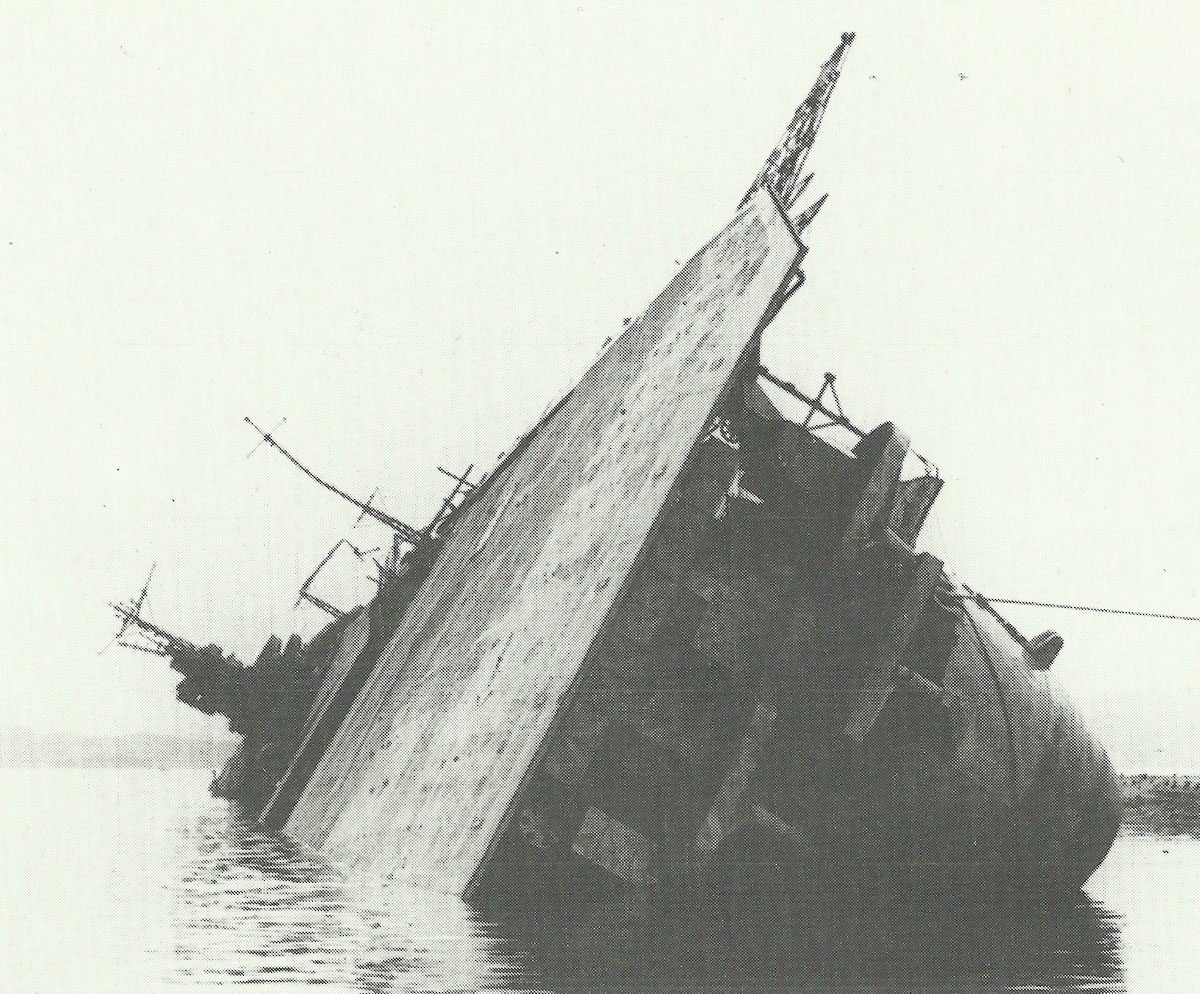
In other words, even with a catastrophic defeat at the Battle of Midway, the U.S. Navy would have matched Japan in terms of aircraft carriers and naval air power by about September 1943.
Nine months later, in mid-1944, the U.S. Navy would have an almost two-to-one superiority in aircraft carrier capacity! Not only that, but with its newer, better aircraft models, the U.S. Navy would not only have a significant numerical advantage, but also a decisive qualitative advantage by the end of 1943.
All this is not to say that a defeat in the Battle of Midway would not have been a major blow to the Americans!
For example, the war would almost certainly have dragged on if the US had not been able to mount a serious counterattack on the Solomons in the second half of 1942. Without any carrier-based air power, there would not have been much hope of such an operation, meaning that the Solomons would most likely have been lost to the Japanese.
However, the long-term implications are clear: the United States could afford to make up losses, which the Japanese simply could not.
Furthermore, this comparison does not take into account the fact that the United States slowed down its carrier construction program in late 1944 as it became increasingly clear that they were needed less.
Had the US lost at Midway, it is likely that these additional carriers (3 Midway-class ships and 6 more Essex-class ships, plus the Saipan-class light carriers) would have entered service sooner.
In a macroeconomic system, the Battle of Midway was actually insignificant. There was no need for the US to fight a single decisive battle that would ‘doom’ Japan – Japan was already doomed by its decision to go to war in the first place.
The final proof of this economic imbalance lies in the development of the atomic bomb. The Manhattan Project required an enormous commitment on the part of the United States. And Paul Kennedy states in his book: ‘… only the United States at that time had the productive and technological resources not only to fight two large-scale conventional wars, but also to invest the scientists, raw materials and money (about 2 billion dollars) in the development of a new weapon that might or might not work’.
In other words, the US economy was so dominant that they could afford to fund one of the largest scientific endeavors in history largely out of the remaining ‘surplus’ from the war effort!
Whatever one may think morally or strategically about the use of nuclear weapons against Japan, it is clear that this development was a demonstration of unprecedented economic strength.
Conclusion
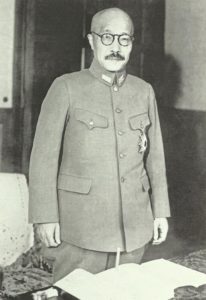
Internal Imperial Navy studies from 1941 showed exactly the same trends in warship construction as described above.
In the end, however, the Tojo government chose the path of aggression, forced by domestic political dynamics, as the prospect of a general Japanese withdrawal from China (which was the only means by which the Allied economic embargo would have been lifted) was too humiliating to accept.
Consequently, the Japanese embarked on what can only be perceived as suicide against an overwhelming enemy.
Their biggest mistake, however, was not just that they ignored the economic power that lay dormant on the other side of the Pacific – the main mistake was that they misjudged the willpower of the American people.
When the American giant awoke, he did not fall into despair at the defeats inflicted on him by Japan.
Rather, it awoke furiously, using every pound of its enormous strength against the enemy with a cold, methodical fury. The cruel price Japan paid – 1.8 million military casualties, the complete annihilation of its armed forces, some half a million civilians killed and the total destruction of all major cities on the home islands bears mute testimony to the folly of its military leadership.
References and literature
World War II – A Statistical Survey (John Ellis)
Luftkrieg (Piekalkiewicz)
Chronology of World War II (Christopher Argyle)
World Aircraft World War II (Enzo Angelucci, Paolo Matricardi)
Flotten des 2. Weltkrieges (Antony Preston)
The Rise and Fall of Great Powers (Paul Kennedy)



Hello.
I am looking for the number of Tractors and Prime Movers Japan produced 1940 to ’45. As this effects Japans military construction.